728x90
Interactive JavaScript charts for your webpage | Highcharts
"I absolutely LOVE Highcharts & maps, very cool! We use it for a web metrics dashboard, which is shared with internal marketing stakeholders. The tool is brilliant and the API documentation is super-helpful. I set up some basic, manual reports using Highch
www.highcharts.com
Basic line | Highcharts.com
www.highcharts.com
Highcharts
- Highcharts는 2009 년에 처음 릴리스 된 순수한 JavaScript로 작성된 차트 작성을위한 소프트웨어 라이브러리이다.
스크립트
<script src="https://code.highcharts.com/highcharts.js"></script>
<script src="https://code.highcharts.com/modules/series-label.js"></script>
<script src="https://code.highcharts.com/modules/exporting.js"></script>
<script src="https://code.highcharts.com/modules/export-data.js"></script>- hightcharts.js : 기본적인 highchart 의 기능
- series-label.js : 데이터에 라벨을 붙일 수 있음
- exporting.js : 그래프를 다운로드 (png, jpeg, pdf, svg)
- export-data.js : 그래프 데이터를 다운로드 (csv, xls)

예제
샘플코드를 가져왔습니다.
더보기
HTML
<!DOCTYPE html>
<html lang="en">
<head>
<meta charset="UTF-8">
<meta name="viewport" content="width=device-width, initial-scale=1.0">
<title>highcharts</title>
<link rel="stylesheet" href="style.css">
</head>
<body>
<figure class="highcharts-figure">
<div id="container"></div>
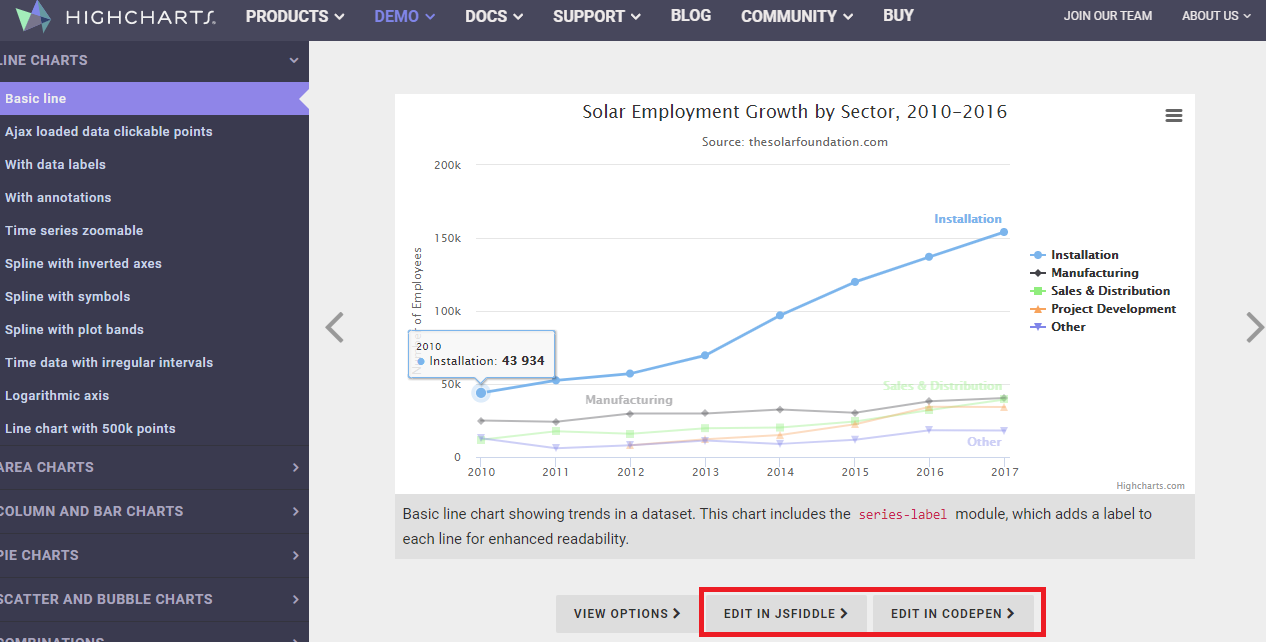
<p class="highcharts-description">
Basic line chart showing trends in a dataset. This chart includes the
<code>series-label</code> module, which adds a label to each line for
enhanced readability.
</p>
</figure>
<script src="https://code.highcharts.com/highcharts.js"></script>
<script src="https://code.highcharts.com/modules/series-label.js"></script>
<script src="https://code.highcharts.com/modules/exporting.js"></script>
<script src="https://code.highcharts.com/modules/export-data.js"></script>
<script src="https://code.highcharts.com/modules/accessibility.js"></script>
<script src="./index.js"></script>
</body>
</html>JS
Highcharts.chart('container', {

    title: {
        text: 'Solar Employment Growth by Sector, 2010-2016'
    },

    subtitle: {
        text: 'Source: thesolarfoundation.com'
    },

    yAxis: {
        title: {
            text: 'Number of Employees'
        }
    },

    xAxis: {
        accessibility: {
            rangeDescription: 'Range: 2010 to 2017'
        }
    },

    legend: {
        layout: 'vertical',
        align: 'right',
        verticalAlign: 'middle'
    },

    plotOptions: {
        series: {
            label: {
                connectorAllowed: false
            },
            pointStart: 2010
        }
    },

    series: [{
        name: 'Installation',
        data: [43934, 52503, 57177, 69658, 97031, 119931, 137133, 154175]
    }, {
        name: 'Manufacturing',
        data: [24916, 24064, 29742, 29851, 32490, 30282, 38121, 40434]
    }, {
        name: 'Sales & Distribution',
        data: [11744, 17722, 16005, 19771, 20185, 24377, 32147, 39387]
    }, {
        name: 'Project Development',
        data: [null, null, 7988, 12169, 15112, 22452, 34400, 34227]
    }, {
        name: 'Other',
        data: [12908, 5948, 8105, 11248, 8989, 11816, 18274, 18111]
    }],

    responsive: {
        rules: [{
            condition: {
                maxWidth: 500
            },
            chartOptions: {
                legend: {
                    layout: 'horizontal',
                    align: 'center',
                    verticalAlign: 'bottom'
                }
            }
        }]
    }

});
CSS
.highcharts-figure, .highcharts-data-table table {
    min-width: 360px;
    max-width: 800px;
    margin: 1em auto;
}

.highcharts-data-table table {
	font-family: Verdana, sans-serif;
	border-collapse: collapse;
	border: 1px solid #EBEBEB;
	margin: 10px auto;
	text-align: center;
	width: 100%;
	max-width: 500px;
}
.highcharts-data-table caption {
    padding: 1em 0;
    font-size: 1.2em;
    color: #555;
}
.highcharts-data-table th {
	font-weight: 600;
    padding: 0.5em;
}
.highcharts-data-table td, .highcharts-data-table th, .highcharts-data-table caption {
    padding: 0.5em;
}
.highcharts-data-table thead tr, .highcharts-data-table tr:nth-child(even) {
    background: #f8f8f8;
}
.highcharts-data-table tr:hover {
    background: #f1f7ff;
}
'Language > Javascript' 카테고리의 다른 글
| Summernote 사용하기 (0) | 2020.08.03 |
|---|---|
| 네이버 SmartEditor2 사용하기 (0) | 2020.08.03 |
| jQuery highcharts 를 이용한 실시간 그래프 그리기 (3) | 2020.07.28 |
| jQuery Ajax 다루기 -1 : GET / POST (1) | 2020.07.28 |
| jQuery Mincolors(색상피커) 플러그인 사용하기 (0) | 2020.07.13 |